Investing in a professional website is a big decision and it’s not one that any business owner takes lightly. It usually means hiring a designer, a copywriter, or maybe a whole team to get the job done, while fully trusting that the end result will actually bring in business.
But here’s the thing a lot of business owners don’t realize until after the site is live: simply having a beautiful, professionally-built website isn’t the finish line.
It’s really just the starting line. Because after you have a beautiful website built, the question becomes… is the website working? Meaning is it actually bringing in traffic, producing leads, and eventually converting people into buyers?
And even more than that, how do you even know if the website is working? Do you have clear data that helps you draw those conclusions effectively and accurately?
If not, it’s hard to know if the investment was worth it. Because yes, of course you want a beautiful website that you can put on display. But if no one is finding it and using it the way you intended, what’s the point, right?
That’s exactly where Jamie Moret, owner of Mini Moo Crew, found herself. Jamie invested in a professional website from my client and friend, Amanda of Studio A Designs, to help her farm reach the right buyers and that investment ended up being the first domino in a much bigger project.
Since Amanda and I have worked together for her own digital marketing reporting dashboard, she knew that Jamie would benefit from something similar. In the early stages of working with Jamie and doing competitor research, it was obvious that Jamie didn’t just need a dashboard – she also needed strategic content on her website to bring in more of the right people to the beautiful website that Amanda built.
That’s when I called on yet another client and friend, Natty of Natty Writes, to craft 6 specific guides in the form of blog posts to ensure that her site included everything she needed to not only exist, but truly work for her, support her audience, and get her closer to her goals.
What started as “let’s build a great website” turned into a full digital marketing strategy that needed a way to actually track what was working. And that’s where I came in!
My work with Jamie started with a custom digital marketing reporting dashboard and evolved from there and in this blog post I’m sharing how!
About Jamie Moret – Owner of Mini Moo Crew

Jamie is the owner of Mini Moo Crew, a family-operated farm in central Iowa that breeds and raises Mini Scottish Highland, Highpark, and HiBelt cattle.
When I first met Jamie and learned more about her background, I was so fascinated! She grew up around cattle – her dad raised beef cattle on the family farm – and she’s brought that lifelong love of the animals into a business built on matching well-socialized mini Highlands with families across the country.
Whether buyers are seasoned farmers or first-timers, Jamie works directly with each one, offering live video chats so people can see a calf’s temperament and personality before committing, and handling every detail of getting the animal safely to its new home.
Mini Moo Crew has placed calves in 18 states, with one calf traveling as far as 1,500 miles to reach its new family. The farm welcomes 25+ calves a year, and it’s also home to Little Paco, a mini Highland bull sired by the well-known bull Little Sancho.
Mini Moo Crew is a business built on relationships and trust, which meant Jamie needed marketing data that was just as easy to trust!
What is a Digital Marketing Reporting Dashboard?
As mentioned above, Jamie and I started working together with one goal in mind: build a digital marketing reporting dashboard so she could see how her beautiful new website was performing and could accurately track how website visitors were converting to leads and buyers.
If you’ve never heard of a digital marketing reporting dashboard before, let me explain!
A digital marketing reporting dashboard pulls data from all the places your marketing lives, such as your website, your ad accounts, your search performance, your contact forms, your social channels, etc. into one place you can actually look at without a headache.
This means that instead of logging into Google Ads, then Google Analytics, then Google Search Console, then Facebook, then Instagram, then a spreadsheet full of contact form submissions, everything shows up in a single view!
And as a business owner, that probablyyyyy sounds like music to your ears because I know we can all relate to trying to keep track of numerous passwords, trying to remember which email account belongs to which platform, and what the heck all those numbers even mean once you finally get logged in.
Overall, a digital marketing reporting dashboard means you can finally see whether the money you’re spending on ads is actually turning into leads, whether your website content is ranking, and whether your leads are turning into paying customers… all without needing a marketing degree or hours of spare time to piece it together.
Mini Moo Crew’s Digital Marketing Reporting Dashboard Overview
💬 Jamie said: “Before working with Rebecca, I knew my business and my customers really well, but a lot of my marketing decisions were based on instinct. I knew what seemed to work, but I didn’t always have the data to explain why.”
I wanted her to have true data to know what was working and why – so I built her dashboard to reflect exactly how her business runs.
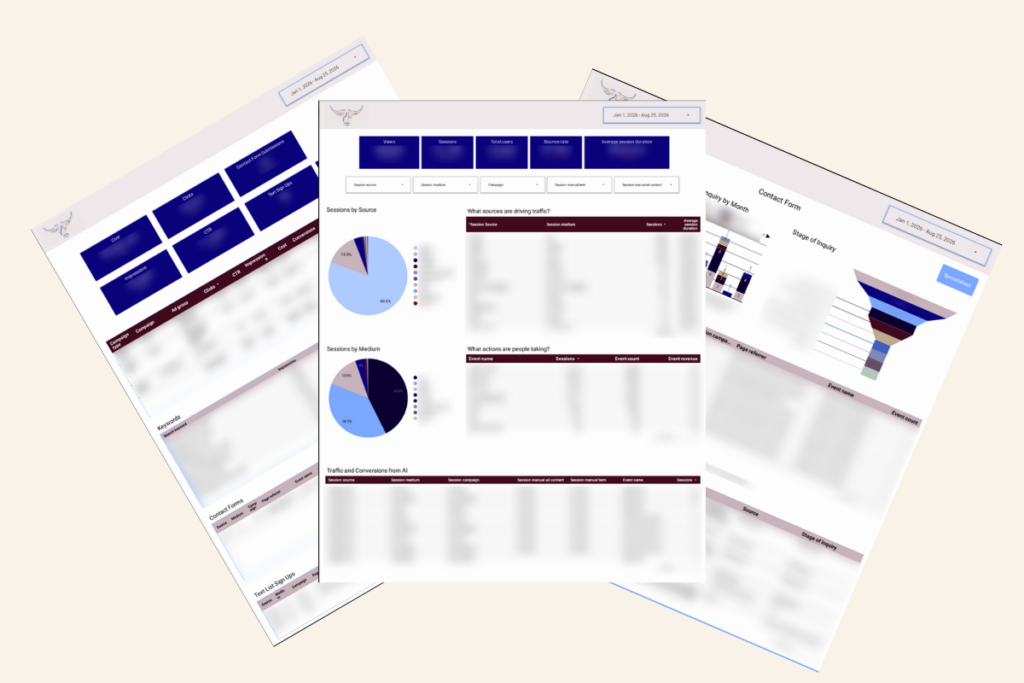
Like most dashboards, it starts with the basics (like general website performance) and then breaks down into the channels that matter most for a farm business built on inbound interest and word of mouth:
- Google Ads – cost, clicks, leads, click-through rate, and impressions, broken out by ad set, keyword, and query type
- Contact forms and text sign-ups – pulled directly into the dashboard so Jamie can see every inquiry in one place
- Keyword and landing page performance – including a visual showing where each keyword sits by average position and impressions, so Jamie can see at a glance which content is performing well (and which needs work)
- Traffic over time, plus a page-level deep dive where Jamie can pull up any landing page or search page and see exactly how it’s performing
- Stage of inquiry tracking – contact form and text sign-up data cross-referenced with where each lead actually is in the buying process, since Jamie manually tracks that in her own records
- A dedicated calves-for-sale page view – this is super unique to Jamie so she can see if a particular listing is pulling unusual traffic
- Google My Business – search impressions, maps impressions, reviews, average rating, calls, bookings, comments, messages, and website clicks
- Facebook, Instagram, and TikTok performance, sortable by views, reach, comments, shares, and average watch time
It’s a lotttt of data, but organized the right way, it gives Jamie one place to check instead of six!
The Process of Building a Custom Digital Marketing Reporting Dashboard
Building a custom digital marketing reporting dashboard like this isn’t just about connecting a few accounts. It starts with truly understanding how a business actually operates day to day (hence the word custom!), which usually involves where leads come from, how they’re tracked, and what the owner actually needs to see versus what’s just noise.
For Jamie, that meant setting up tracking across her Google Ads account, her website analytics, and her search console data, then layering in the manual tracking she already did (like recording each inquiry’s stage in the sales process), so that data could be compared side by side with what Google was reporting.
It also meant pulling in the social platforms she was active on and setting up her Google My Business profile from scratch, since it hadn’t been claimed before.
Some pieces, like Google Ads call tracking, are still being layered in as new capabilities become available. And that’s the beauty of a digital marketing reporting dashboard like this – it’s not just a one-and-done build. It’s meant to evolve as the business does!
Mini Moo Crew’s Journey Working With Three Groves
What I’ve loved the most about working with Jamie is that the digital marketing reporting dashboard was just the beginning! While I of course really enjoy creating dashboards for clients and letting them run with it, I also REALLY love when I get to go beyond analytics and help them further in their business.
And that’s exactly what happened with Jamie. After I delivered her dashboard, she moved into my Kickstart Your Lead Generation service and after that we started working together with an Ongoing Ads and Analytics Retainer.
💬 Here’s what Jamie had to say about this process:
“A dashboard is a tool. Rebecca is the person behind it. As a business owner wearing multiple hats, having Rebecca in my corner puts my mind at ease. I don’t have to constantly watch the numbers or wonder if I’m missing something. I know she is paying attention, and I trust her to tell me when something matters.
At the end of the day, I trust Rebecca enough to follow her lead. You can build a dashboard in a one-time project. You can’t build that level of trust and understanding in a one-time project.
Rebecca doesn’t just give me more data to think about – she helps me cut through the weeds, figure out what actually matters, and make a decision so we can keep moving.”
What is Kickstart Your Lead Generation?
Kickstart Your Lead Generation is a done-with-you paid ads package built for business owners who are ready to run ads but don’t want to figure it out alone. Over 6–8 weeks, it includes:
- An initial strategy call, creative call, and business manager setup call
- A training portal and Avatar Deep Dive Questionnaire to nail down messaging and audience
- Audience research and a full funnel review
- Hands-on ad implementation, optimization, and testing
- Weekly analytics reporting and reviews
The goal by the end of the 6–8 weeks isn’t just to have ads turned on and running, but rather have a repeatable lead generation system in place that you can turn on and off as you please!
I designed this service for the business owner who knows they want to run paid ads, but they want hands-on support in the beginning to ensure they’re doing it in a way that will produce the best results for their business.
By the end of it, some clients feel confident enough to run things on their own! But other clients realize they’d rather hand off the whole thing and that’s what happened with Jamie.
After working together with Kickstart Your Lead Generation, she moved into an Ongoing Ads and Analytics Retainer and I still have the pleasure of working with her today!
How To Know If You’re Ready for an Ongoing Ads and Analytics Service Provider
Not every business is ready to jump into a full Ads and Analytics Retainer right away, and that’s totally okay.
It’s also not always the right time for you to even do that, so if you’ve been considering working with someone like me to help you run ongoing ads and keep a pulse on your marketing analytics for you, here’s a few signs it might be the right time:
✔️ You’re regularly checking your dashboard and starting to have real questions about the data
✔️ You’ve seen early results (leads, traffic, engagement) and want to build on the momentum instead of losing it
✔️ You don’t have the time or expertise to manage ad accounts, SEO, and content on your own
✔️ You want a marketing partner tracking trends over time, not just a one-time report
For Jamie, the early wins from her dashboard and her new blog content made the case clearly – the data showed real movement and she wanted an ongoing partner to keep building on it.
💬 Jamie said: “I don’t want to spend months figuring out whether something is working. If it’s doing great, let’s understand why and do more of it. If it’s doing poorly, let’s figure that out quickly, make an adjustment and move on.”
That’s the kind of fast, confident decision-making an ongoing partnership with me makes possible!
Mini Moo Crew’s Results Within 3 Months of Working Together
Speaking of those wins, let me just give you some perspective at what we were working with!
The first blog post she published brought in over 200 views and over 170 sessions, with an average session duration over 2 minutes – all of this was a strong sign that visitors were actually reading the content, not just clicking away.
Nearly 100 of those visits came from organic search and the post has already reached over 4,000 search impressions, sitting at an average 7th position with almost 50 clicks back to the site.
This is just proof of how blogging in your business is one of the best ways to give you more marketing data to measure!
On the lead and sales side:
- May – 12 leads at an average cost of ~$75 each, with what appears to be two cow purchases from one buyer
- June – 10 leads at an average cost of ~$91 each, with 1 confirmed purchase (roughly a 10% conversion rate)
- July – 7 leads at an average cost of ~$54 each, with no confirmed purchases yet
What the dashboard also revealed is something a lot of small business owners suspect, but can’t usually prove: buyers don’t always convert right away.
One lead first reached out in May and didn’t purchase until June – the dashboard made it possible to connect those dots by phone number and see the full journey.
Several other current leads are on wait lists, have visited the farm in person, or were referred to other buyers in Jamie’s network, meaning more sales could still be on the way even though they haven’t shown up in the numbers yet!
The dashboard hasn’t just clarified Jamie’s leads though… it has also helped her understand growth she was already seeing but couldn’t fully explain.
💬 In her words: “A year ago, Mini Moo Crew’s customer base was entirely within the United States. Today, we have international customers who have purchased our genetics.”
Being able to see the data behind that shift, and understand where that interest was coming from, has changed how she reads her own business’s momentum!
Ready for Your Own Digital Marketing Reporting Dashboard?
Overall, if you’re running a business and making marketing decisions based on gut feelings instead of real data, a digital marketing reporting dashboard can change that!
Like Jamie, you don’t need to become a marketing expert overnight – you just need a clear view of what’s actually happening across your ads, your website, and your social channels, all in one place.
Once you have a clear picture of your data, then you can make the best use of paid ads in your business and trust that you’ll know exactly how they’re performing.
A custom digital marketing reporting dashboard is where I encourage everyone to start, so if you’re ready to get your own dashboard, CLICK HERE to learn more!