


Ever wonder what path people take when they visit your website?
What’s the first page they hit?
Do they read your blogs before checking out your services?
Do they download your lead magnet after visiting your service page?
You don’t have to wonder anymore!
Google Analytics Path Exploration Report can show you exactly how visitors move through your website.
Let me show you how to use it!!
How to Access the Path Exploration Report
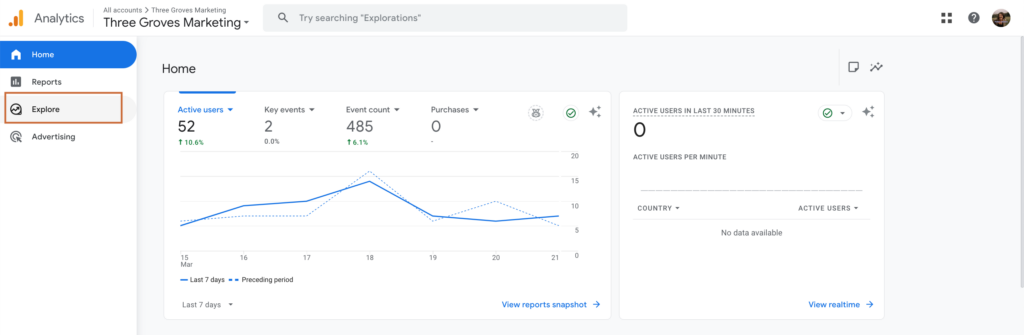
First, open up Google Analytics and navigate to the Path Exploration Report. You’ll find this in the left-hand menu under “Explore.”
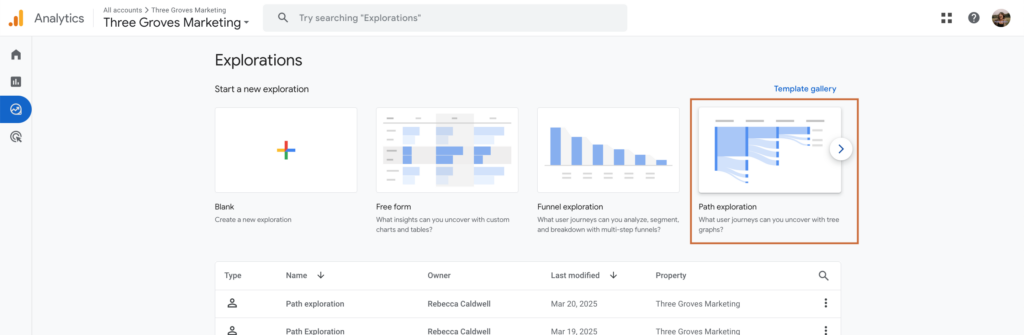
Choose “Path Exploration”
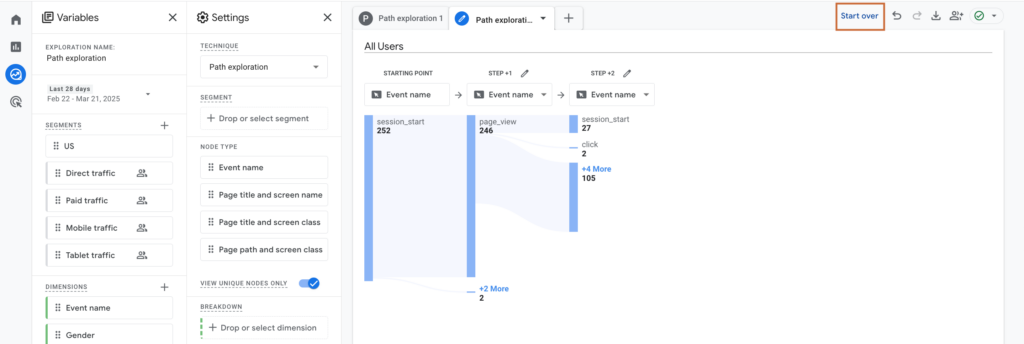
Once you open it, you’ll see a visual representation of how users move through your site, starting from when they first land on a page.
Customizing Your Path Analysis
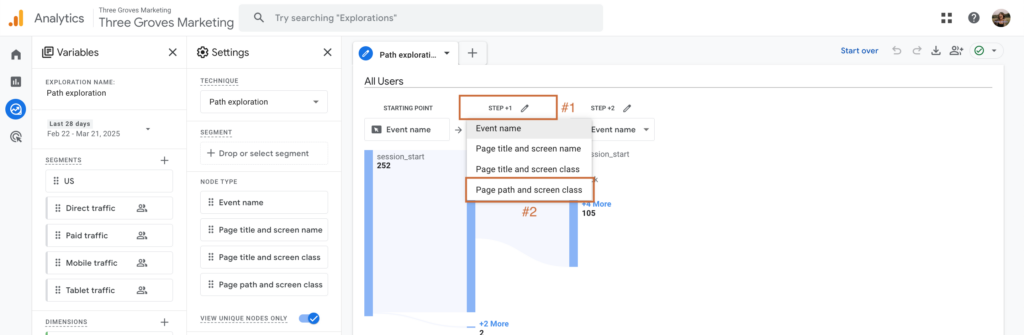
Here’s how I like to set up my path exploration:
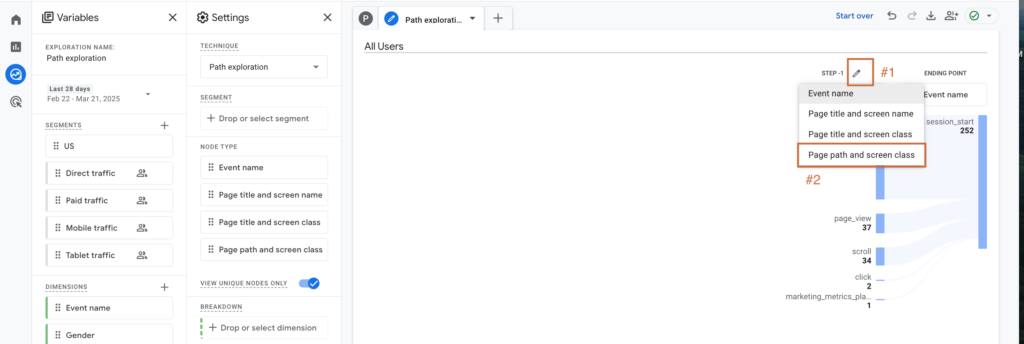
- For the first step, keep the default “session_start” event – this shows where people initially land
- For subsequent steps, change the dimension to “page path and screen class” so you can see the exact pages people visit (the slug)
This simple change gives you much clearer insights into your visitors’ journey!
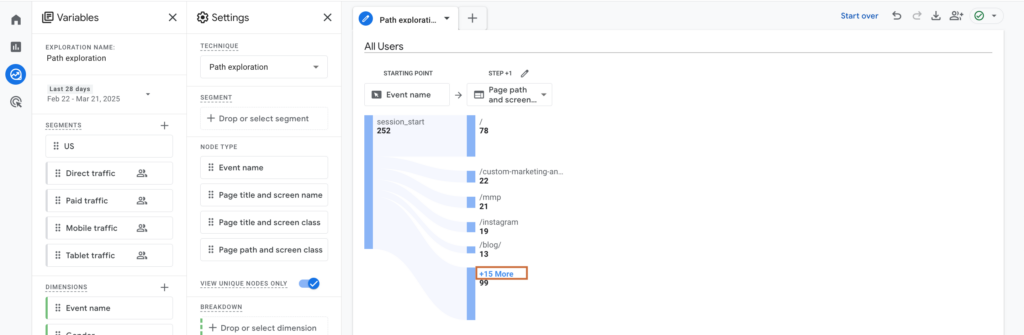
Reading Your Path Data
Once your report is set up, you’ll see blue bars representing the different paths users take.
The size of each bar indicates the volume of traffic flowing through that path.
When you see “more”written in blue, you can click to expand and see additional paths that didn’t fit in the initial view.
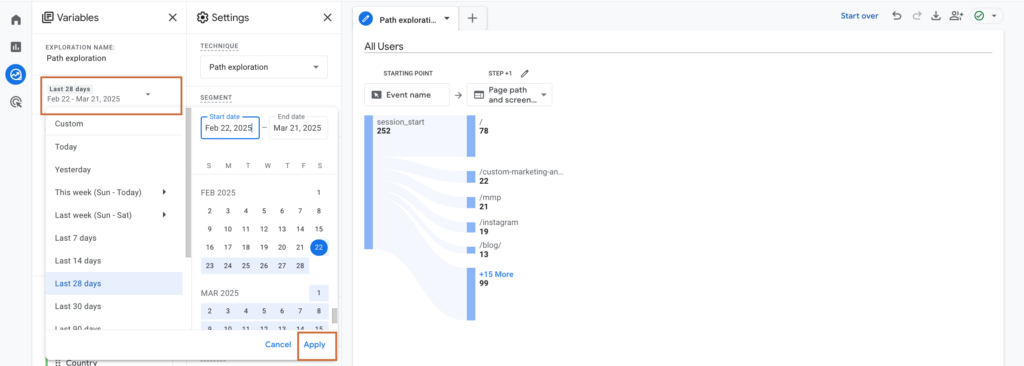
If you’d like to change the date for your report, you can do so by clicking the date section on the left
When you are reading your data you might find out:
- Where most of your visitors land initially
- Which pages they visit next
- How deep into your site they go before leaving
Knowing the answers to these questions can help you make improvements to increase the time users spend on your website and your bounce rate.
Ask yourself
- Where are visitors dropping off?
- Is there something you can do to improve that final page?
- Does it need more internal links?
- Are there questions you need to answer to help people make the decision they are trying to make on that page?
- If the solution they are looking for isn’t on that page — what’s the next best step and how do you get them to that page?
- Is there something you can do to improve that final page?
- Are there any surprise patterns?
- Do people visit an unexpected page after your important pages (like service or call scheduling page) if so:
- What conclusion can you pull from that data?
- Do you need to make any improvements?
- Do people visit an unexpected page after your important pages (like service or call scheduling page) if so:
Real-World Example
On my own site, I noticed something interesting. When people read my blog post about collaborations for email list growth:
- Some visited my about page to learn more about me
- Others explored more blog posts
- A few checked out my DIY Marketing Measurement Bundle
- Some downloaded my free Marketing Measurement Playbook
When I dug deeper into those who visited my about page after reading the blog, I discovered most of them went on to check out my services page, which is exactly what I want them to do!
This kind of insight is gold for understanding how your content connects and moves people through your site — now I know that blog post is generating interest in my services.
Analyzing Backwards From a Conversion Event
Want to know what path leads to conversions?
You can also view paths backwards by starting from a conversion event!
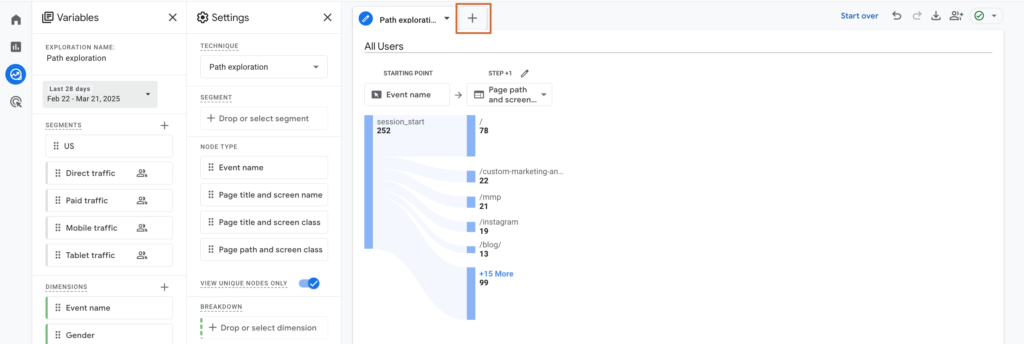
To do this:
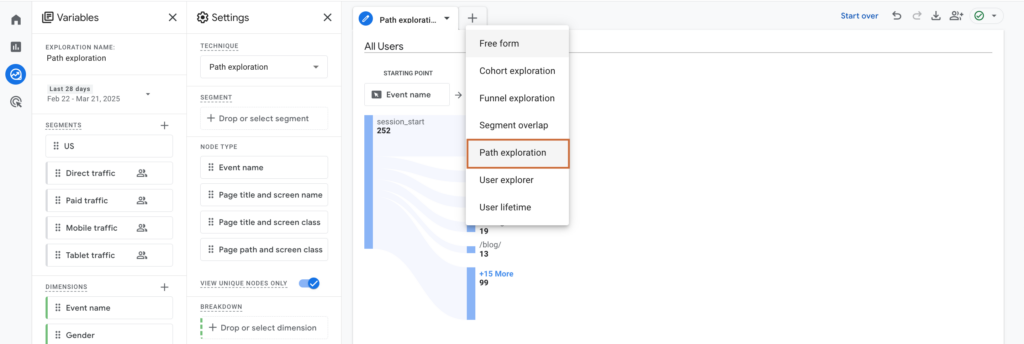
- Click the “+” button to create a new path exploration
2. Choose “Path Exploration” again
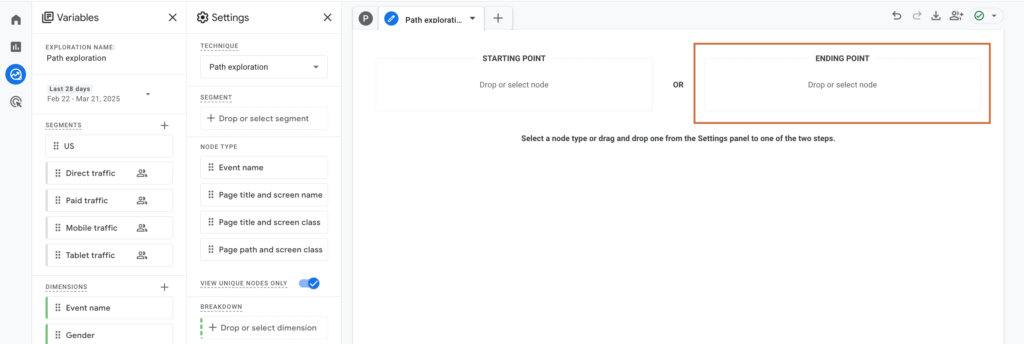
3. Select “Start over”
4. Choose to start from an ending point
5. Select event name (like a lead magnet download)
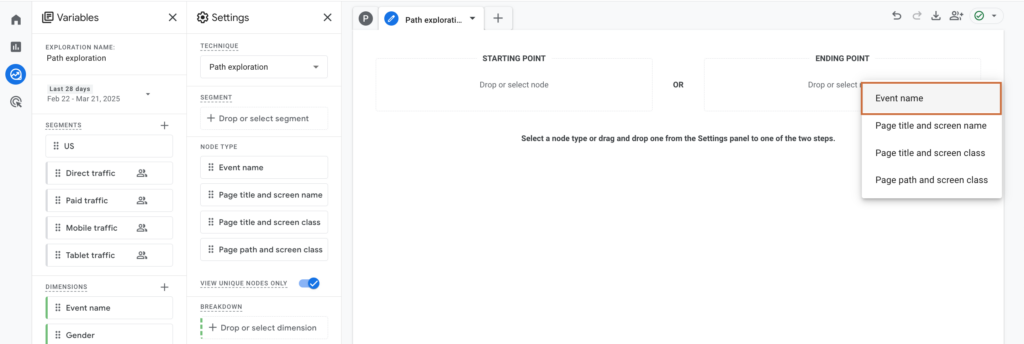
6. Choose an event (You can click the blue bar to change events)
Here’s how I like to set up my path exploration:
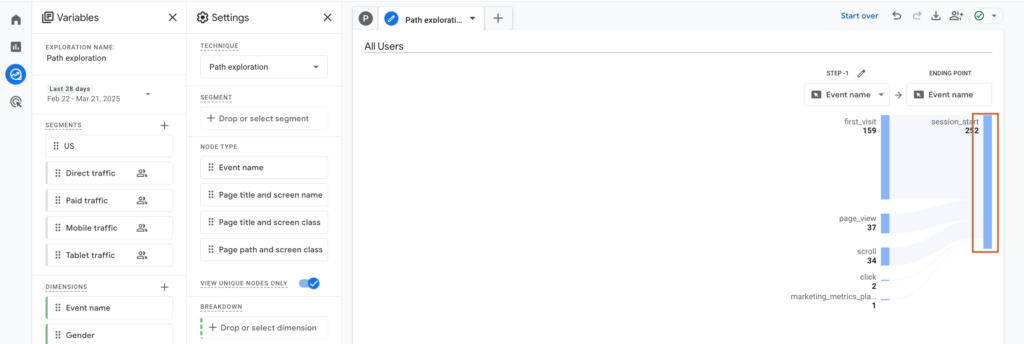
- For the first step, choose whatever event you’d like to – this shows what conversion event people complete
- For subsequent steps, change the dimension to “page path and screen class” so you can see the exact pages people visit (the slug)
This shows you all the different paths people took before completing that conversion, which can help you optimize your highest-performing pathways.
Tracking your website visitors journey allows you to answer questions like:
- Do you need to move any call to actions around?
- Do you need to create more internal links than you already have?
While you are reading your data ask yourself these questions:
- Are there any pages or blogs that contribute to a majority of your key event conversions?
- Do you send traffic to those pages as often as you can?
- Do you need to make any changes to your content plan to improve conversion? (Example: are you spending a lot of time talking about Blog A when Blog B is the better conversion driver?)
- Are these pages that you hoped would be driving more conversions?
- Can you see and understand the gaps you need to fill to capture more conversions?
- Do you need a stronger call to action?
- Do you need to answer more questions?
- Do you need to more succinctly communicate the value on the page?
- Can you see and understand the gaps you need to fill to capture more conversions?
Making the Most of Path Exploration
You could spend 8,000 hours inside this report (trust me, I’ve lost track of time here more than once! 🙈).
But it’s worth it to discover:
- Where users are dropping off
- Which content naturally leads to other content
- How visitors move through your sales funnel
- Which pages contribute most to conversions
- Opportunities to improve internal linking
Taking Action on Your Insights
Once you understand how people move through your site, you can make strategic improvements:
- Add relevant CTAs on pages that commonly precede conversions
- Create better internal links between related content
- Optimize pages with high drop-off rates
- Strengthen pathways that commonly lead to sales or conversions
Important Note
Without these, you won’t be able to track the most important actions on your site.
Things like your lead magnet, opt ins, or call bookings.
Your Turn!
Ready to track your website visitors’ journey?
Hop into Google Analytics and start exploring those paths!
You might be surprised by what you discover about how people actually use your site versus how you thought they would.
If you try this out and have questions or discover something interesting about your website traffic, I’d love to hear about it!
Drop a comment below or send me a DM on Instagram
And if you’re feeling a bit overwhelmed by all this data and what to do with it, remember that I’m here to help make marketing metrics make sense!
Check out my Custom Marketing Analytics Dashboard if you’d like support turning your website data into actionable insights.


leave a comment