Let me guess, friend… you know your Instagram analytics like the back of your hand – from follower count, to your average number of likes, comments, and story views. There’s a good chance you check these numbers daily or at least have a pretty steady pulse on what’s happening on your account.
And I love that you’re paying attention to some analytics for your business! After all, that’s what I’m all about over here at Three Groves.
But can I ask you… do you know what’s actually happening after someone clicks that link in your bio? Are they opting in for freebies? Buying from you? Are they even making it to your website?
For a lot of business owners, if they’re brutally honest with themselves, they have no clue. Not because they don’t care about the data, but simply because piecing it together from 5 different platforms feels like a part-time job nobody signed up for.
So if you can relate to knowing your Instagram analytics, but not much beyond that, I want you to know that you’re not alone and it’s not your fault.
There is SO much to learn and keep up with as a business owner and if you don’t love data or numbers then this can be a big one that feels easy to skip.
But what if I told you that simply having an accurate pulse on what’s happening in your business (beyond Instagram) could actually be the thing that helps you get MORE of the results you really want?
Like more quality opt-ins to your email list, more people consuming your content, and yes, more sales.
Skylor French, founder of The Photobooth Edit, has experienced this first hand. She went from being your classic “Instagram analytics only” business owner to having a custom marketing reporting dashboard that helped her make better marketing decisions that ultimately landed her 50+ new members in her core offer in just 4 months of working together.
About Skylor French – Founder of The Photobooth Edit
Skylor (known to her community as Sky) is the founder of The Photobooth Edit (TPE), home to the Booth Stock Membership – a stock photo membership built specifically for photobooth business owners who want to elevate their marketing without spending hours behind a camera themselves.
Through Booth Stock, members get access to a monthly drop of styled, on-trend stock photography, bonus templates, and mini trainings, all designed to help photobooth owners stand out, attract higher-end clients, and stop scrambling for content.
What makes Booth Stock so cool is that it’s literally been built by someone who has lived the EXACT problem she’s solving! Sky grew her own photobooth company, Smirk Photobooth Co., from the ground up and understands firsthand how much visual content it takes to compete in this industry.
With a growing membership, an active free opt-in, a large content-rich website, and marketing efforts spread across Meta, Pinterest, email, and her member community in Circle, Sky had no shortage of data.
What she didn’t have was a way to see it all in one place or the confidence to know what any of it actually meant. So that’s what we set out to change together!
What is a Marketing Reporting Dashboard?
Before diving into Sky’s project, I first want to make sure we’re clear on what a marketing reporting dashboard actually is… starting with what it’s not.
A marketing reporting dashboard is NOT a generic analytics export or a template report dumped in front of you with no context.
That approach usually leaves business owners with more questions than answers: what does this number mean? Is this good or bad? Why does this even matter to my business?
A true marketing reporting dashboard – one that reflects actual data and one that you’ll actually use – is a centralized system, built around how your specific business operates, that pulls your scattered data into one place and translates it into decisions you can actually act on.
For Sky, that meant connecting:
- Google Analytics 4
- Meta (Facebook + Instagram) ads and organic data
- Flodesk email marketing data
- Interact quiz funnel data
- Stripe revenue data
- Circle community engagement
- Internal spreadsheets tracking members, purchases, and affiliates
Instead of showing Sky more numbers to feel overwhelmed by, the goal was to answer the questions that actually move her business forward: where are my leads coming from? Are people using my free opt-in? What’s driving actual purchases, not just traffic?
TPE’s Custom Marketing Reporting Dashboard Overview
As mentioned earlier, when Sky reached out, she wasn’t running short of marketing effort. She had an active membership, a free opt-in, consistent content, and a quiz funnel – she just couldn’t see how any of it was connecting.
💬 In her words: “I strongly believe in knowing analytics to see what is working BUT I fail to look past Instagram analytics just out of overwhelm!”
She wanted to know where her audience was converting inside her email funnel from her five free photos opt-in, how people were actually finding her, and whether the time she was investing in marketing outside of Instagram was working.
She also had a bigger goal in mind for how she wanted to grow:
💬 “This year I would love to focus on more ‘passive’ marketing. I hate riding the non-stop to-do list of creating consistent organic traffic, and I want to build more awareness for my business and lead people onto my site and funnels.”
And when asked what would make the project feel successful, her answer was simple and honest:
💬 “I don’t even know what I’m looking at when I go into Ads Manager, so just having you set that up and hold my hand through it – to know how things are working and running, and what to look at to know if something is a success – will be a success!”
That combination – data scattered everywhere, real ambition to grow beyond organic content, and a desire to finally understand her numbers instead of just staring at them – is exactly what her custom marketing reporting dashboard was built to address.
The Process of Building a Marketing Reporting Dashboard
Every marketing reporting dashboard I build is custom to the business it’s built for, and Sky’s was no exception!
Here’s a closer look at what went into it:
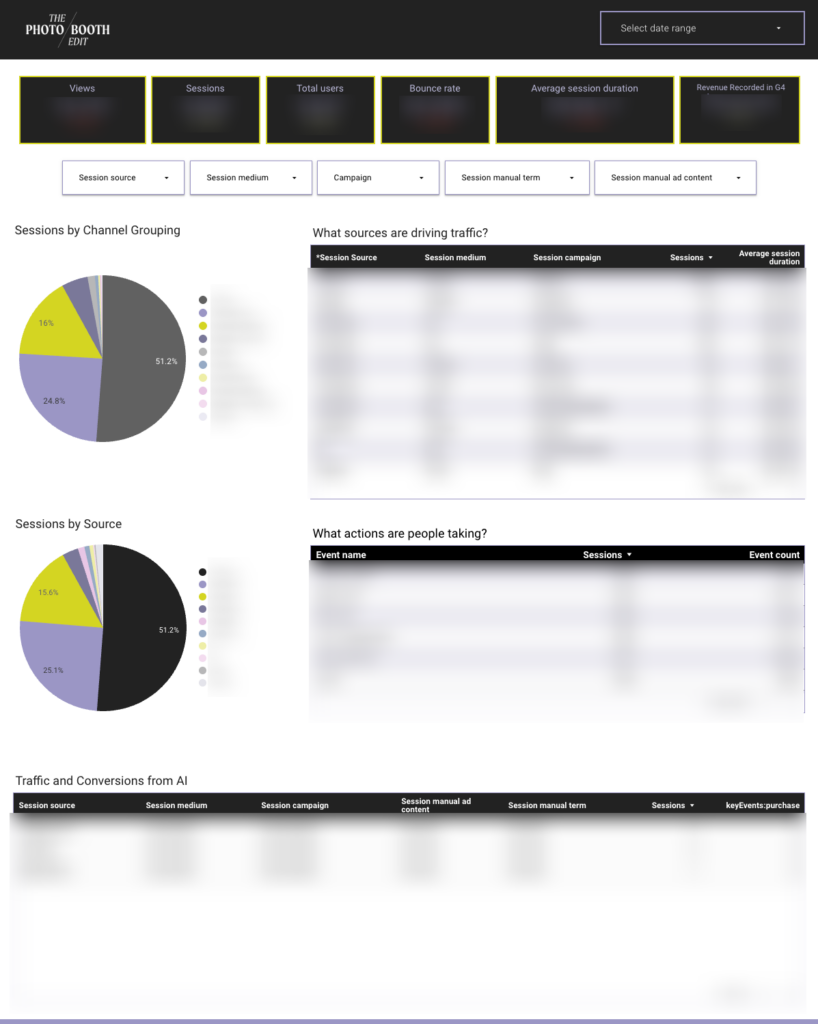
Website and Traffic Visibility
The foundation started with a standard traffic layer, including sessions, engagement, sources, plus visibility into her growing AI-driven traffic.
Opt-in and Lead Attribution
Because Sky runs both organic and paid traffic to similar offers (like her 5 Free Photos opt-in), a dedicated page was built to separate where each lead actually came from – Facebook ad traffic versus organic and social – so nothing got miscounted.
Meta Ads Performance
A full Facebook/Instagram ads page tracks landing page visits, opt-ins by source, and purchases, including performance on a low-cost tripwire offer used to test whether cold traffic would convert into a first purchase.
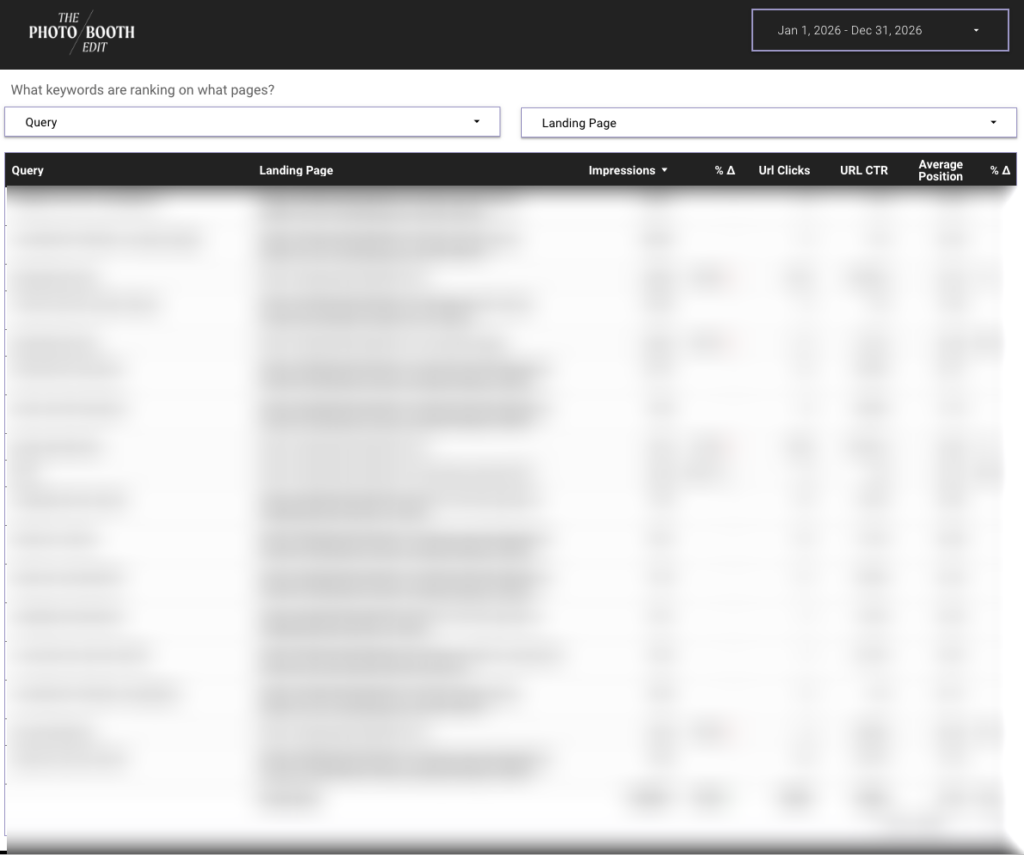
Content and SEO performance
Because Sky’s site is large, her most-visited pages and most-visited product pages were split out separately, alongside keyword rankings and traffic trends, so SEO decisions could be made page by page instead of guessing.
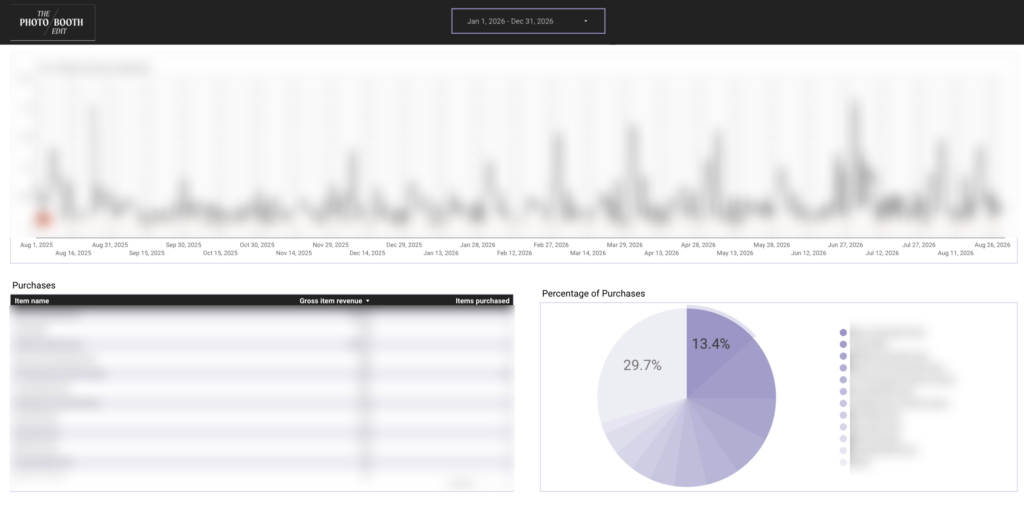
Single Product Purchases
After the first build, it became clear more granularity was needed here, so a dedicated page was added to show which channels were actually driving individual product purchases, and which of her many “mini packs” were performing best.
A Daily Sales Tracker
This one came straight from something Sky cared about emotionally, not just strategically – never having a day go by without a sale. That’s a goal I can get behind, but I would neverrrr want someone trying to track that manually.
Inside her dashboard, I built a tracker that reflected sales from the start of 2025 showing just how few gaps there’ve been. This is something she can pull up on a hard day as reassurance that things are, in fact, going well!
Membership Sales, Revenue, and Roster Tracking
From real-time Stripe revenue to a full member roster (lifetime value, source, billing frequency, active status) to new member and churn tracking by month, this layer gave Sky visibility into not just if people were joining, but when they were leaving and why.
Churn data specifically highlighted a steep drop-off around month six, which is now shaping where new member touchpoints get built.
Community and Funnel Visibility
Finally, the dashboard tracks engagement inside her Circle community and quiz funnel performance, giving her a full-picture view of every corner of her marketing ecosystem.
From Custom Marketing Reporting Dashboard to Kickstart Your Lead Generation to Ongoing Ads and Analytics Retainer
Here’s the part of Sky’s story I’m most excited about though… creating a marketing reporting dashboard wasn’t the finish line for us. In fact, it was really just the starting point.
Some clients come to me for a dashboard and leave with exactly that and that’s perfectly fine! But I really love when I have the opportunity to support a client’s marketing efforts beyond just their analytics and that’s exactly what I’ve been able to do with Sky, simply because she has clear goals and focuses and she wants extra support with those.
Once Sky had a clear, centralized view of her data, the natural next step became obvious: she was ready to run paid ads with confidence, because her tracking was finally solid enough to trust the results.
That’s the whole philosophy behind starting with a dashboard before ever turning on ad spend and why I encourage every business owner to do the same.
So often in business, you hear chatter about running paid ads to grow your email list or sell out your launch and while I’m of course a big fan of paid advertising, I’m also a big fan of doing the right things in the right order.
At the end of the day, you want to know your numbers actually work before you start paying to grow them.
After receiving her custom marketing reporting dashboard, Sky moved into my Kickstart Your Lead Generation service and once that wrapped, she rolled straight into an ongoing Ads and Analytics Retainer.
If I’m being so honest, this is the client journey that I hope every dashboard client eventually takes and Sky is one of the first to walk through the entire path from start to finish!
What is Kickstart Your Lead Generation?
Now you might be wondering… what exactly is Kickstart Your Lead Generation and why did it make sense for the next best choice for Sky? Let me explain!
Kickstart Your Lead Generation is a done-with-you paid ads package built for business owners who are ready to run ads but don’t want to figure it out alone.
Over 6–8 weeks, it includes:
- An initial strategy call, creative call, and business manager setup call
- A training portal and Avatar Deep Dive Questionnaire to nail down messaging and audience
- Audience research and a full funnel review
- Hands-on ad implementation, optimization, and testing
- Weekly analytics reporting and reviews
The goal by the end of the 6–8 weeks isn’t just to have ads turned on and running, but rather have a repeatable lead generation system in place that you can turn on and off as you please!
For Sky, this phase ran through April and May, and it’s where testing really began, including trying a low-ticket tripwire offer to see whether cold ad traffic would convert into a first purchase before ever asking for a bigger buy!
We pressed publish on her ads on April 2nd and here’s what happened:
- Spent less than $1k
- Grew over 200 leads
- Had 8 membership sales
- Sold over $500 in single products
In just ONE MONTH!!!
What’s Included with an Ongoing Ads and Analytics Retainer with Three Groves
Once Kickstart wrapped, Sky moved into an ongoing Ads and Analytics Retainer, which is the best option for business owners who are ready to hand off their paid advertising long-term instead of managing it themselves.
This includes:
- Everything from the Analytics Groundwork and Kickstart phases
- Ongoing testing of ad creative, audiences, and offers
- Continuous optimization based on real performance data
- Regular reporting so Sky always knows what’s working and why
Beyond the ads themselves, the retainer relationship grew to include something Sky didn’t originally ask for but needed: a real project management system.
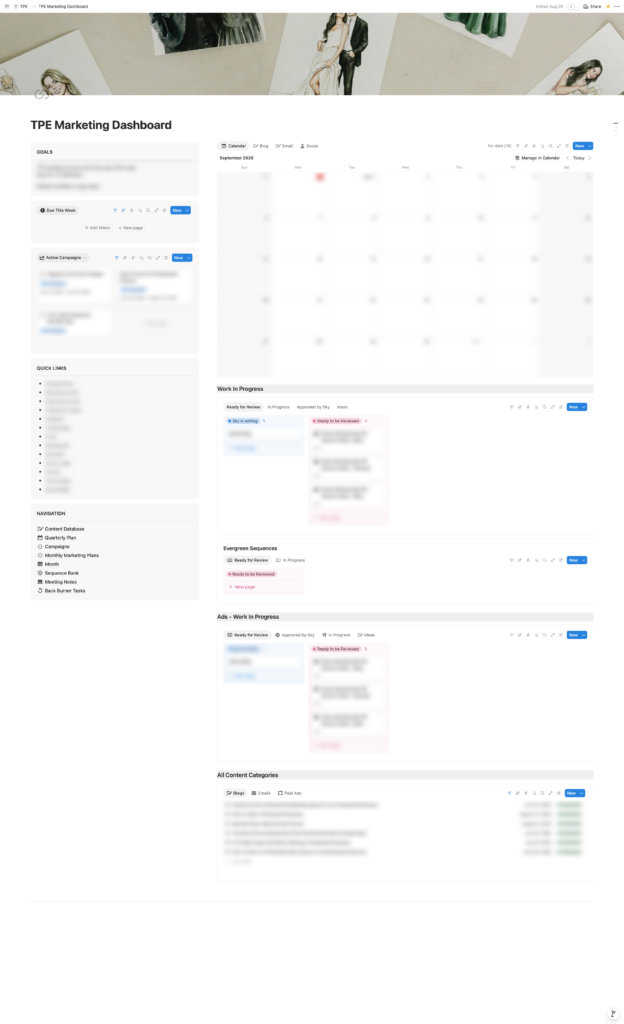
Early on, planning projects over Google Meet wasn’t cutting it, so a Notion-based marketing control center was built specifically for her, complete with a shared content and ad calendar, active campaign tracking, meeting notes, and a running list of ideas for what’s next.
It’s not a metrics tool, but it’s become the operational backbone that keeps the ongoing partnership organized and moving!
TPE’s Results In Just 4 Months of Working Together
Now for what you’re probably really wondering… what kind of results has Sky experienced since we started working together?
Since starting together in April 2026, here’s what’s happened for The Photobooth Edit:
- 50+ new members, with over half still active today
- 800+ new email leads, with over 600 of them directly attributable to Meta ads
- Monthly single-purchase revenue that exceeded the first goal she set (all before the planned post-purchase email sequences were even live!)
- Creating a validated tripwire offer that’s now paving the way for a full automated post-purchase sequence designed to upsell TPE’s mini packs
And that’s just the beginning! These results happened simply because Sky finally decided it was time to truly understand her marketing data and make data-driven decisions for her business. 👏🏼
Ready for Your Own Marketing Reporting Dashboard?
If you’re like Sky was – putting in real, consistent marketing effort but stuck staring at Instagram analytics wondering what’s actually working outside of it – a custom marketing reporting dashboard might be exactly the missing piece!
It’s not about adding more numbers to your plate, but rather about finally seeing your marketing clearly enough to make confident decisions. And, if or when you’re ready to run paid ads, knowing your tracking will actually tell you the truth.
A custom marketing reporting dashboard is where I encourage everyone to start, so CLICK HERE to learn more and see if it’s the right next step for your business!