


If you’ve ever spent hours on a marketing task – whether it was writing a blog post, creating an Instagram carousel, recording a YouTube video, publishing a podcast episode, or honestly anything to market your business – and later caught yourself wondering…
“Was spending all that time on that really worth it?”
You’re not alone.
I’d actually argue this is a question most business owners ask themselves because, well… you’re busy. Between client work, team responsibilities, and your personal life, you want to know that the time you’re investing in your business is actually moving it forward.
But the reality is that a lot of business owners don’t know the answer to that question.
Instead, they’re making marketing decisions based on gut feelings, assumptions, or whatever seems like it’s working.
As my client Michael King put it, they’re… “Just flying in the dark.”
And while that might work for a season – and may even help you create growth you’re proud of – if your goal is to build a business that feels intentional, scalable, and sustainable, eventually you have to know that the work you’re doing is worth it.
And to be clear… “worth it” is going to look different for every business owner.
For Michael, “worth it” meant knowing exactly where his traffic was coming from, and more importantly, exactly how that traffic was converting into sales.
The easiest way to get that kind of clarity is by having a Custom Data Studio Dashboard that tracks your traffic sources, engagement, and revenue in real time, so you know what needs attention, what’s actually converting, and what’s already working.
That’s exactly what Michael King, founder of The CFO Accelerator, wanted! And after building his custom dashboard, the guesswork was officially gone.
Let’s break down what we built and how it changed the way his team makes marketing decisions. 👇
About Michael King – Fractional CFO
Before diving into Michael’s custom Data Studio dashboard, it’s important to understand who he is and what he does!
Michael King is the founder of The CFO Accelerator, where he helps accountants and finance professionals start, scale, and optimize their fractional CFO firms.
Through courses, coaching, live events, memberships, YouTube content, and consistent thought leadership on LinkedIn, Michael has built a strong brand in the CFO space.
But like many founders with multiple marketing channels, he had one major challenge: a lot of activity… but not enough clarity on what was actually working and was worth his time.
That was Michael’s main goal and that’s exactly what a custom Data Studio dashboard helped him solve!
What is a Custom Data Studio Dashboard?
To fully understand this project, it’s important that you first understand what a custom Data Studio dashboard is!
You may be thinking… “I already have Google Analytics set up. Why do I need a custom dashboard?”
And that’s a great question! Most business owners know that tracking your analytics is important so they do the thing that they hear others talk about and call it a day.
For many, that means simply setting up their Google Analytics account, making sure their website is connected, andddd maybe checking it once a month (if they remember).
But simply checking your Google Analytics isn’t all that helpful if you’re not actively doing anything with the data it’s giving you! And that’s often the problem for most business owners that I talk to.
The data is there… but they don’t know what it means or what to do with it. So that’s where a custom dashboard changes things!
A custom Data Studio dashboard is a reporting system built around your specific business goals – not just the default reports you get inside analytics tools.
Instead of looking at disconnected numbers across platforms, a custom dashboard pulls your data into one place so you can answer bigger business questions like:
- Where is my traffic coming from?
- Which channels are actually converting?
- Is my [insert platform] content driving sales?
- Is my [insert platform] strategy worth the time investment?
- Which product pages are generating revenue?
- What content deserves more optimization?
For Michael, the goal wasn’t just to see traffic. It was to connect traffic → engagement → offers → purchases → revenue. So here’s how we did it. 👇
Michael’s Reality Before Using a Custom Data Studio Dashboard
💬 As mentioned earlier, when Michael reached out, he described his marketing visibility as, “we’re just flying in the dark right now.”
He had built a strong content engine across multiple platforms, including:
- Website content
- LinkedIn thought leadership
- YouTube content
- Email list growth
- Product launches
- Membership offers
- Paid advertising
The problem, however, is that they were running their analytics solely through Kajabi and that platform wasn’t giving his team the insights they needed to make data driven marketing decisions.
💬 In his words, Michael said, “we had very little information to track our marketing metrics.”
Which really meant that they were putting in TONS of effort across various platforms and truly just guessing and hoping their way through it.
But Michael knew they couldn’t keep doing things that way. He wanted to know:
- Which traffic sources were driving sales?
- Was LinkedIn traffic converting?
- Was YouTube traffic converting?
- Which pages were worth optimizing?
- Which offers were performing best?
- Were paid ads actually producing leads and purchases?
So the goal of this project became clear: build a custom Data Studio dashboard that would show exactly what was driving traffic, engagement, and revenue.
The Process of Building a Custom Data Studio Dashboard for a Fractional CFO
What I love so much about building custom analytic dashboards for my clients is that each one really is custom to their specific business, their wants, and their needs.
What I created for Amanda is different from what I created for Carrie and what I created for Carrie is different from what I created for Michael.
For example, Amanda was interested in seeing her operational sustainability – aka her hours worked – to ensure that her business is growing in a way that aligns with the life she wants.
Carrie, on the other hand, really wanted to be able to calculate cost per acquisition for her paid community members.
And Michael? Well he had one main question: “Is it worth spending those three hours [on his YouTube content strategy]?”
That one question shaped much of his custom dashboard build, because when content is a major growth channel, you need more than vanity metrics – you need feedback. And that’s exactly what Michael’s dashboard now provides!
This project quickly became much more than a standard analytics setup. It evolved into a multi-page reporting system built around Michael’s entire customer journey.
Here’s a quick recap of what I put into place:
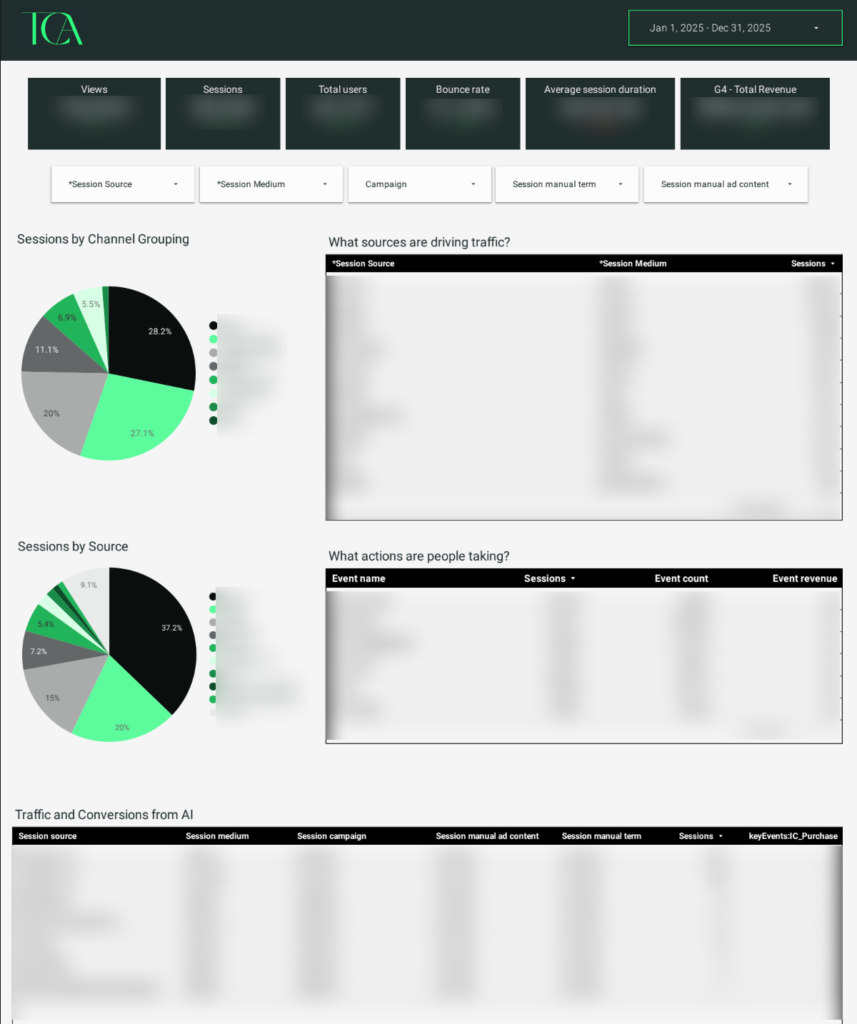
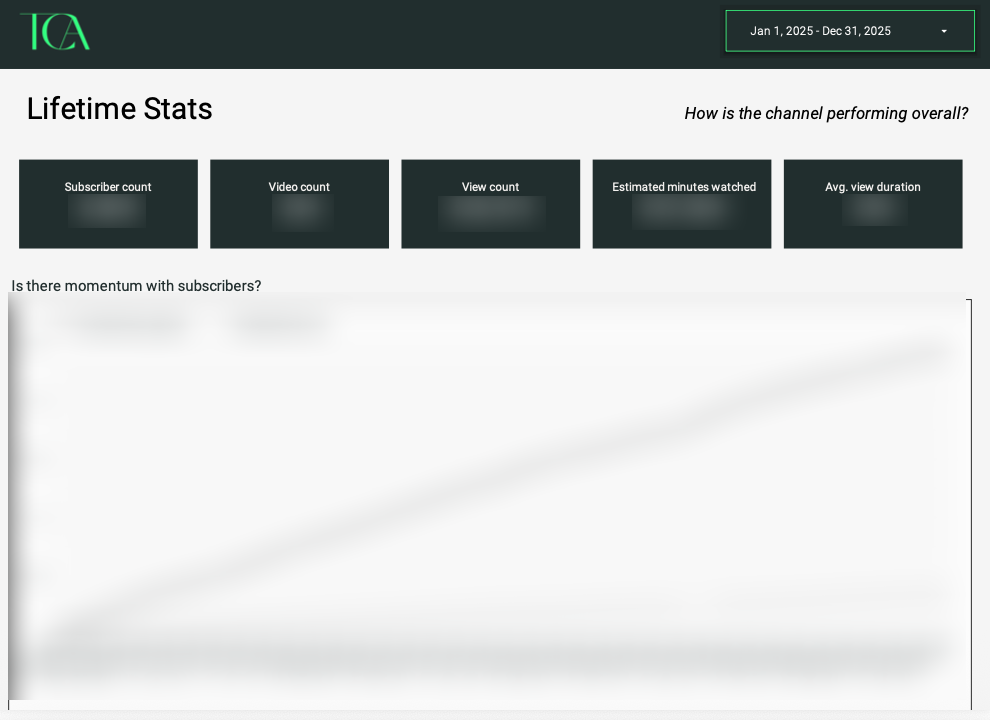
Website Performance & Core Metrics
The dashboard homepage was designed to give Michael’s team immediate visibility into:
- Sessions
- Users
- Bounce rate
- Average session duration
- Revenue
- Traffic sources
- Channel groupings
- Key site actions and conversions
This is that “basic” data that every dashboard should include – whether you’re DIYing yours or investing in a custom build – so you can have an instant “big picture” view of your business performance.
Page Engagement Reporting
As mentioned, one major priority was understanding which pages were worth investing more time into and this section gave insight into just that by tracking:
- Most visited pages
- Session volume
- Average page duration
- Engagement rate
Now Michael can quickly identify which content deserves updates, optimization, or stronger calls to action.
Product & Revenue Attribution
Because Michael sells multiple offers, including courses, memberships, live events, and templates, individual reporting pages were built for each product.
This includes:
- CFO Academy
- Inner Circle
- Live events
- Template packs
- Email offers
Each product page tracks:
- Traffic sources
- Sessions
- Purchases
- Conversion rates
- Coupons used
- Payment processor data
- Cash collected
This allows Michael’s team to connect marketing channels directly to revenue.
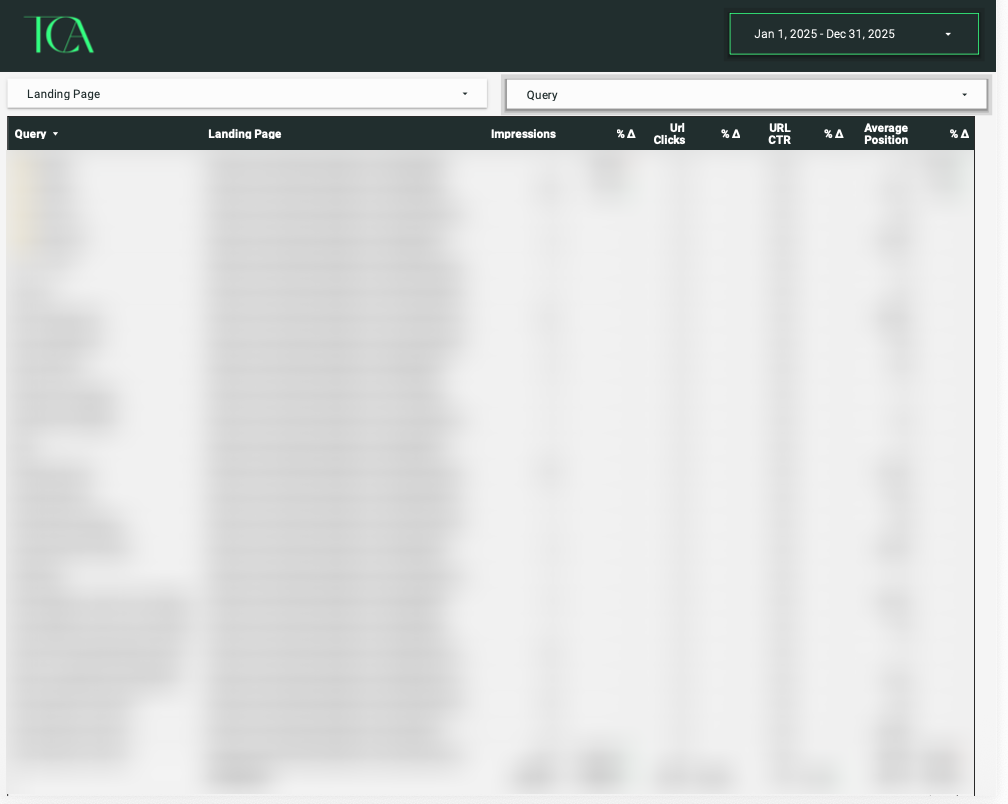
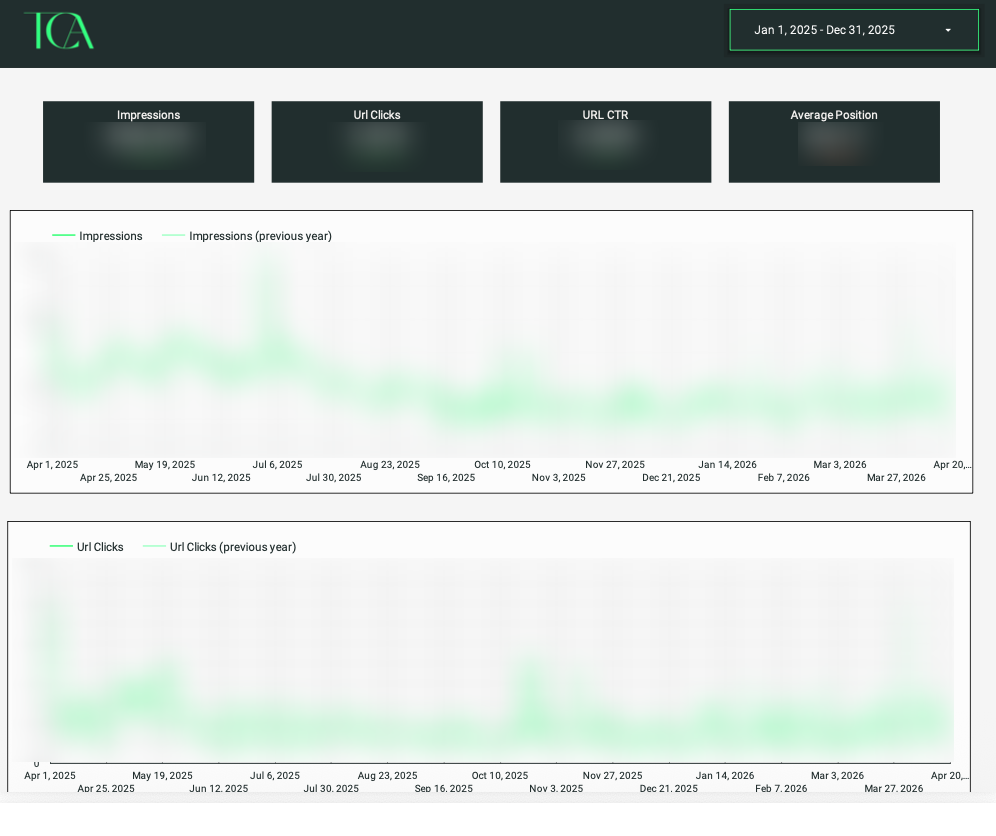
SEO & Search Visibility
To support organic growth, the dashboard also combines Google Analytics and Google Search Console to include:
- Keyword rankings
- Click-through rates
- Search impressions
- Landing pages
- Average search position
- Page-level SEO deep dives
Now Michael can see whether his content strategy is actually improving visibility over time and can easily identify where changes may need to be made in the future!
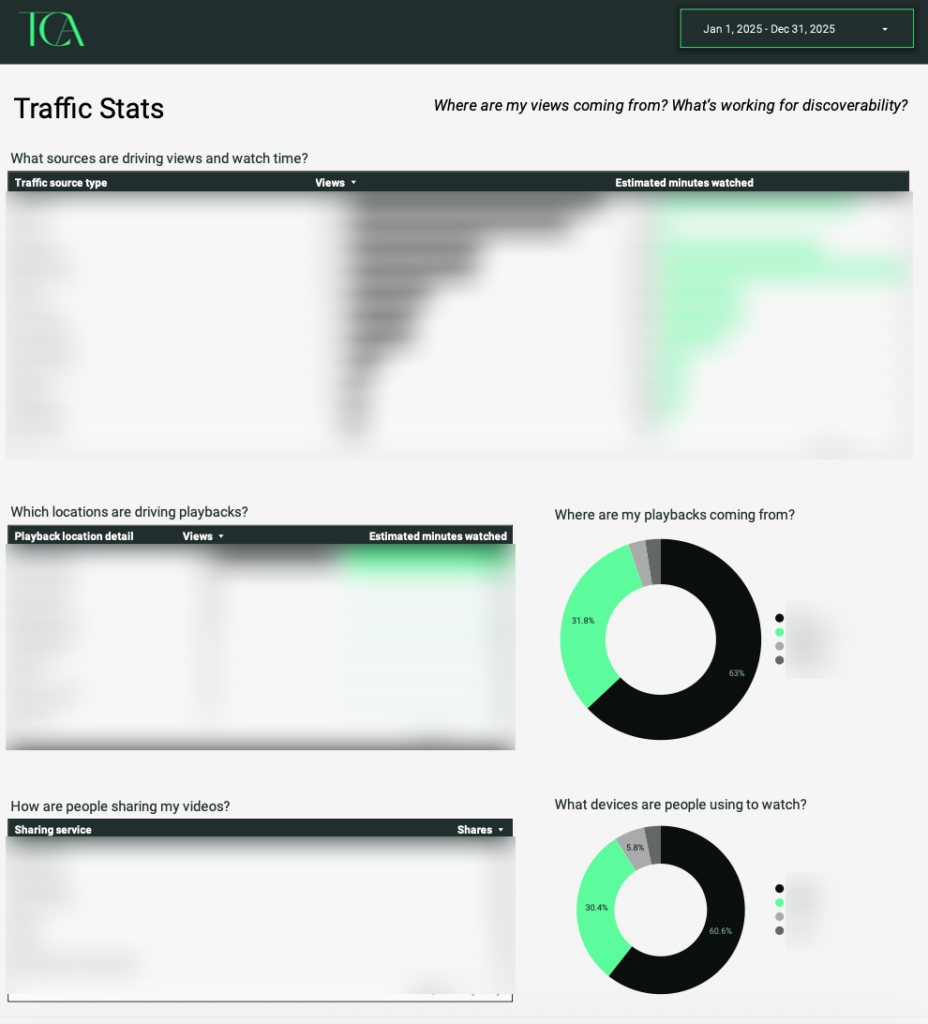
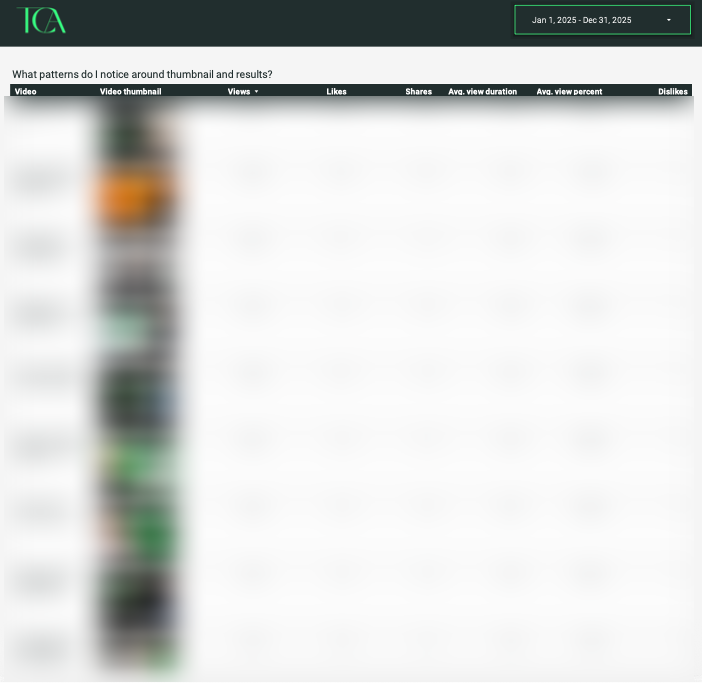
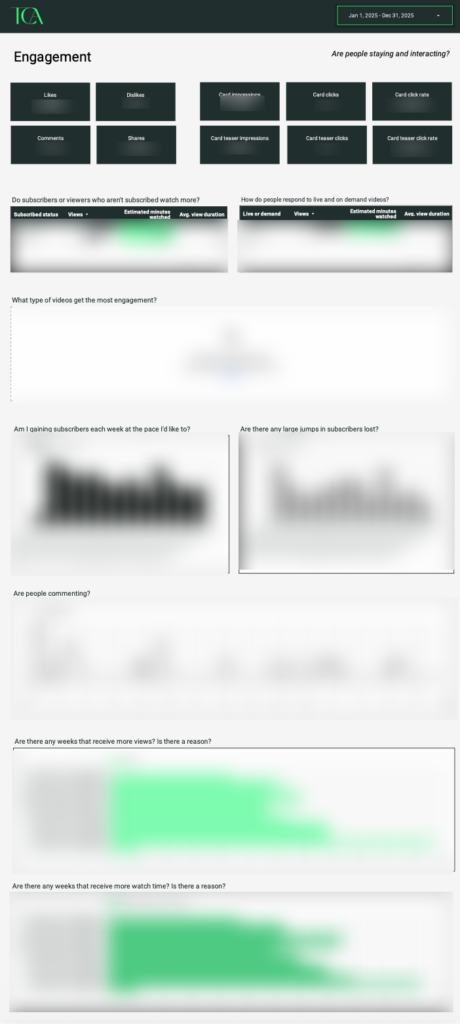
YouTube + LinkedIn Tracking
This became one of the most valuable parts of the project because Michael specifically wanted to know if his LinkedIn and YouTube efforts were actually driving buyers.
Custom tracking was built to help answer:
- Which videos drive traffic?
- Which viewers become buyers?
- What video formats perform best?
- What thumbnails, titles, and video styles generate results?
This required multiple workarounds due to API limitations and connector restrictions, but those challenges were solved with custom reporting workflows!
Paid Advertising Performance
As Michael expanded into paid media, additional reporting pages were added for Meta and LinkedIn ads to track:
- Landing page visits
- Leads
- Cost per lead
- Click-through rates
- Purchases
- UTM conversions
This gives his team confidence in where ad spend is actually producing results!
The Result of Having a Custom Data Studio Dashboard
After implementation, Michael’s team no longer has to play a guessing game of what’s working and what’s not.
Instead, they can track their traffic sources and revenue in real time and KNOW what’s working, what needs changed, or what might need to be scrapped altogether.
Because that’s the power of having a pulse on your marketing analytics that you truly understand… you have the confidence to STOP doing something when the numbers suggest it’s no longer worth your time.
And I don’t know about you my friend, but that is such a freeing feeling as a business owner!
💬 As Michael shared: “Now that the dashboard is complete, my team can track our traffic sources and sales in real time. This gives us a great feedback signal on what we need to change and what we should leave alone. The guesswork has been eliminated.”
Ready for Your Own Custom Data Studio Dashboard?
If you’re creating content consistently, but still asking questions like:
- Where are my leads actually coming from?
- Is my content converting?
- Which channels are worth my time?
- What offers are actually driving revenue?
A custom Data Studio dashboard can help you stop guessing and start making decisions with real data!
Instead of bouncing between platforms, spreadsheets, and incomplete reports, you’ll have one centralized reporting system built around your business goals.
If you’re ready to build a dashboard that turns your data into a decision-making system, you can CLICK HERE to learn more about my Custom Marketing Dashboard service!
A custom marketing dashboard can take your data from something that’s just sitting there to something that’s readable and automated so that you actually ENJOY looking at it!
A Note From The Client
“Rebecca was the consummate professional during the entirety of this project. I felt like she understood what we were looking for and she knew exactly how to deliver on it!”
Communication Satisfaction: 5 Stars
Outcome Satisfaction: 5 Stars


